Luxembourg Economy, Luxembourg Economy
Advertisement
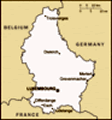
Economy - overview: This stable, high-income economy - in between France, Belgium, and Germany - features solid growth, low inflation, and low unemployment. The industrial sector, initially dominated by steel, has become increasingly diversified to include chemicals, rubber, and other products. Growth in the financial sector, which now accounts for about 22% of GDP, has more than compensated for the decline in steel. Most banks are foreign-owned and have extensive foreign dealings. Agriculture is based on small family-owned farms. The economy depends on foreign and cross-border workers for more than 30% of its labor force. Although Luxembourg, like all EU members, has suffered from the global economic slump, the country enjoys an extraordinarily high standard of living.
GDP: 0.9% (2003)
GDP - real growth rate: 2.3% (2004 est.)
GDP - per capita: Purchasing power parity - $58,900 (2004 est.)
GDP - composition by sector: Agriculture: 0.5% industry: 16.3% services: 83.1% (2004 est.)
Population below poverty line: NA%
Household income or consumption by percentage share: Lowest 10%: NA% highest 10%: NA%
Distribution of family income - Gini index:
Inflation rate (consumer prices):
Labor force: 293,700 (of whom 105,000 are foreign cross-border workers commuting primarily from France, Belgium, and Germany) (2004 est.)
Labor force - by occupation: Agriculture 1%, industry 13%, services 86% (2004 est.)
Unemployment rate: 4.5% (December, 2004 est.)
Budget: Revenues: $13.74 billion expenditures: $14.49 billion, including capital expenditures of $760 million (2004 est.)
Industries: Banking, iron and steel, food processing, chemicals, metal products, engineering, tires, glass, aluminum, information technology, tourism and banking
Industrial production growth rate: 2.9% (2004 est.)
Electricity - production: 2.511 billion kWh (2002)
Electricity - production by source:
Electricity - consumption: 5.735 billion kWh (2002)
Electricity - exports: 2.9 billion kWh (2002)
Electricity - imports: 6.3 billion kWh (2002)
Oil - production: 0 bbl/day (2001 est.)
Oil - consumption: 50,650 bbl/day (2001 est.)
Oil - exports: 634 bbl/day (2001)
Oil - imports: 50,700 bbl/day (2001)
Oil - proved reserves:
Natural gas - production: 0 cu m (2001 est.)
Natural gas - consumption: 865 million cu m (2001 est.)
Natural gas - exports: 0 cu m (2001 est.)
Natural gas - imports: 867 million cu m (2001 est.)
Natural gas - proved reserves:
Agriculture - products: Barley, oats, potatoes, wheat, fruits, wine grapes; livestock products
Exports: $13.4 billion f.o.b. (2003)
Exports - commodities: Machinery and equipment, steel products, chemicals, rubber products, glass
Exports - partners: Germany 22.1%, France 20.1%, Belgium 10.2%, UK 8.4%, Italy 7.3%, Spain 5.9%, Netherlands 4.3% (2004)
Imports: $16.3 billion c.i.f. (2003)
Imports - commodities: Minerals, metals, foodstuffs, quality consumer goods
Imports - partners: Belgium 29.8%, Germany 22.6%, China 12.6%, France 12%, Netherlands 4.2% (2004)
Debt - external: $NA
Economic aid - recipient:
Currency:
Currency code:
Exchange rates: Euros per US dollar - 0.8054 (2004), 0.886 (2003), 1.0626 (2002), 1.1175 (2001), 1.0854 (2000)
Fiscal year: Calendar year
Advertisement
The information here has been derived from Public Domain Sources such as the CIA World Factbook. No liability can be taken for any inaccuracies.
Tot: 0.041s; Tpl: 0.008s; cc: 3; qc: 8; dbt: 0.011s; 1; m:domysql w:travelblog (10.17.0.13); sld: 1;
; mem: 1.1mb

 Founded in 963, Luxembourg became a grand duchy in 1815 and an independent state under the Netherlands. It lost more than half of its territory to Belgium in 1839, but gained a larger measure of autonomy. Full independence was attained in 1867. Overr...
